InfluxDB
See also Grafana and join the #influxdb:phys.ethz.ch chat room.
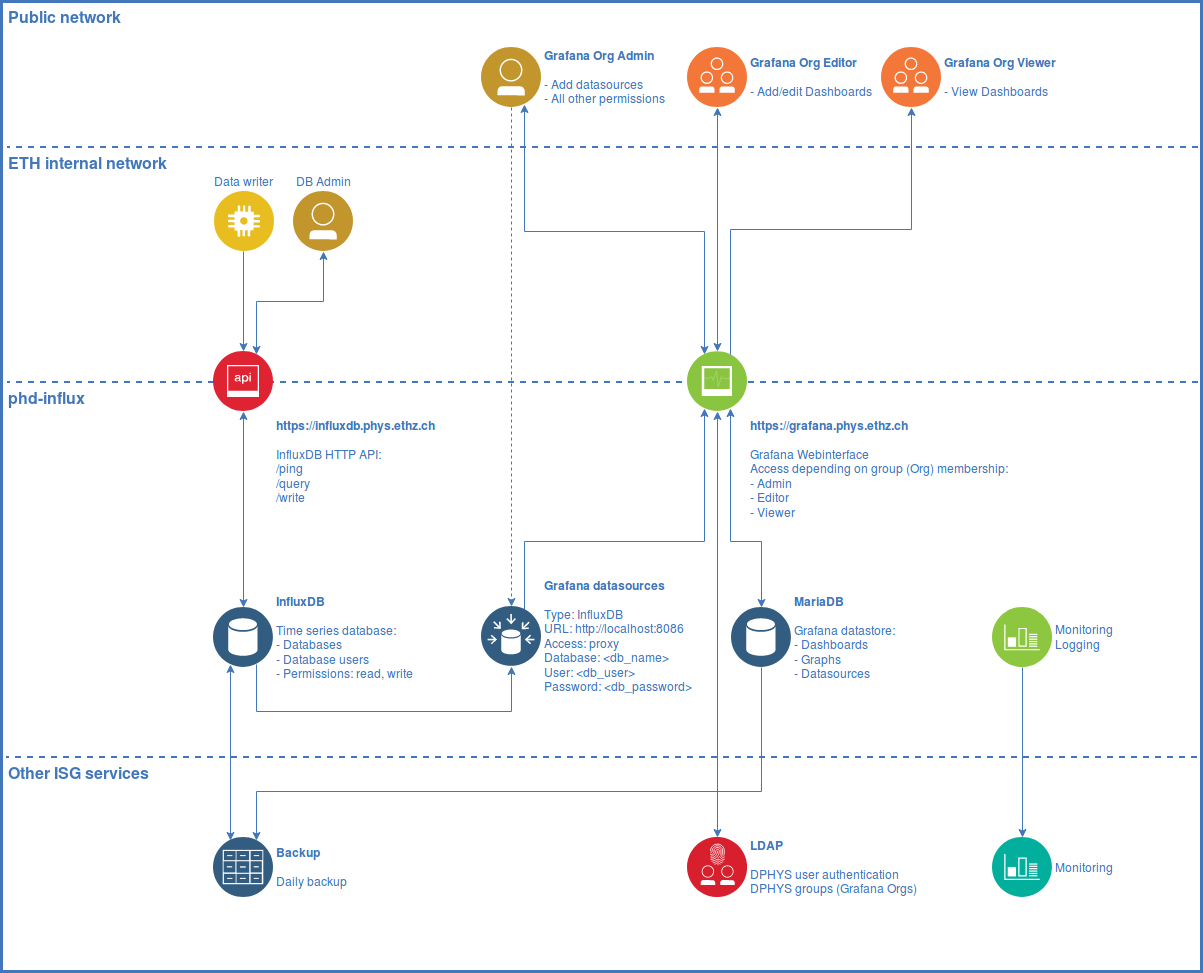
We provide an InfluxDB service at influxdb.phys.ethz.ch.
InfluxDB is an open-source time series database developed by InfluxData. It is optimized for fast storage and retrieval of time series data in fields such as operations monitoring, application metrics, Internet of Things sensor data, and real-time analytics.
Getting a database
To request a database, please contact us, providing the desired dbname, which must be namespaced with your organization (example: <orgname>_<dbname>). If it does not already exist, a new Grafana Organization will be created for your group. We usually create two database users per organization, one with read-only access permissions for Grafana and one with read-write for sensors and admin tasks.
Please note that it is more efficient to use a single database for different kinds of experiments. You can use tags and fields to organize your measurements. Tags are indexed and provide fast queries to select data. Use them to tag your measurements by Location, Room, Experiment, etc.
The only reason for separating into multiple databases is access permissions.
Data migration (backup/restore)
If you already have an existing InfluxDB running and want to migrate your data to our server, please create a backup using the method described in the backup guide and contact us to import the data.
Alternatively you may also write the data yourself via the HTTP API (see write endpoint below). To import large amounts of data yourself, please use the InfluxDB command line interface (CLI/shell), which is explained below.
Getting started with InfluxDB
The instructions below should get you started interacting with InfluxDB using the HTTP API. Please refer to the InfluxDB API reference for an in-depth tutorial on interacting with the database. Complete Documentation for InfluxDB can be found by accessing the official manual.
Our InfluxDB service is behind a HTTP proxy. You do not need to specify a port in the URL of the HTTP request,
as the proxy service listens on the standard HTTPS port 443. The following InfluxDB endpoints are
available via the proxy from within the ethz.ch domain.
If access is required from outside the ETHZ network, please contact us.
- URL:
https://influxdb.phys.ethz.ch/ - Port (optional):
443
To query or write data to any database requires authentication, please use the respective
database, user and password combination in your requests.
You will receive a notification from ISG with the credentials upon database creation.
Should you require another user for an existing database,
please contact us, providing database, user and access permissions (READ and/or WRITE).
Note: Access has to be approved by the database owner.
/ping
Use the /ping endpoint to check the connectivity and the status of our InfluxDB instance.
This endpoint accepts both GET and HEAD HTTP requests.
curl -sl -I https://influxdb.phys.ethz.ch/ping
This request will result in a HTTP 204 response if successful:
HTTP/1.1 204 No Content
Date: Mon, 26 Mar 2018 16:17:38 GMT
Server: Apache/2.4.25 (Debian)
Content-Type: application/json
Request-Id: [...]
X-Influxdb-Version: 1.5.0
...
/write
Use the /write endpoint to write data to a pre-existing database.
This endpoint accepts POST HTTP requests.
curl -i -XPOST -u user:password \
'https://influxdb.phys.ethz.ch/write?db=mydb' \
--data-binary 'cpu_user,host=myhost value=0.64'
This request will result in a HTTP 204 response if successful:
HTTP/1.1 204 No Content
...
Do not use the -i parameter for production, as it will print the HTTP-header in the output.
If you have a large number of data points, write several points to the database mydb by separating points with a new line:
curl -XPOST -u user:password \
'https://influxdb.phys.ethz.ch/write?db=mydb' \
--data-binary 'cpu_user,host=myhost1 value=0.64
cpu_user,host=myhost2 value=0.65
cpu_user,host=myhost3 value=0.66'
Or write several points to the database mydb from the file data.txt:
curl -XPOST -u user:password \
'https://influxdb.phys.ethz.ch/write?db=mydb' \
--data-binary @data.txt
A sample of the data in data.txt:
mymeas,mytag1=1 value=21 1463689680000000000
mymeas,mytag1=1 value=34 1463689690000000000
mymeas,mytag2=8 value=78 1463689700000000000
mymeas,mytag3=9 value=89 1463689710000000000
Please refer to the InfluxDB API reference for full details.
/query
Use the /query endpoint to query data. This endpoint accepts GET and POST HTTP requests.
curl -G -u user:password \
'https://influxdb.phys.ethz.ch/query?db=mydb&pretty=true' \
--data-urlencode 'q=SELECT * FROM "cpu_user"'
This query will return pretty-printed JSON:
{
    "results": [
        {
            "statement_id": 0,
            "series": [
                {
                    "name": "cpu_user",
                    "columns": [
                        "time",
                        "host",
                        "value"
                    ],
                    "values": [
                        [
                            "2018-03-26T16:41:04.660322699Z",
                            "myhost",
                            0.64
                        ]
                    ]
                }
            ]
        }
    ]
}
Please refer to the InfluxDB API reference for full details.
InfluxDB command line interface
For manual database inspection or maintenance the InfluxDB CLI should be used.
Usage
Start the influx client on any managed Linux workstation or via ssh in our login node:
ssh <username>@login.phys.ethz.ch
influx -precision rfc3339
Installation
On a self-managed Debian/Ubuntu system, run the following commands as root to install it:
apt install influxdb-client
Connect
To connect to our server using the influx CLI, enter the following:
influx -precision rfc3339 \
-host influxdb.phys.ethz.ch -port 443 -ssl \
-database <db> -username <user> -password <pw>
This will establish a connection to the server and show the following prompt:
Connected to https://influxdb.phys.ethz.ch:443 version 1.x
InfluxDB shell version: 1.x
>
You can now use InfluxQL commands to interact with the database.
Import
To import data from a file containing data in line protocol (example: export.txt):
# DML
# CONTEXT-DATABASE:<db>
B18-AC1 airFlow=4320 1505088017000000000
B18-AC1 airFlow=4185 1505088077000000000
B18-AC1 airFlow=4185 1505088137000000000
use the following command:
influx -host influxdb.phys.ethz.ch -port 443 -ssl \
-database <db> -username <user> -password <pw> \
-import -path=export.txt
Please note that you need to at least supply a DML (Data Manipulation Language) header with the correct CONTEXT-DATABASE.
InfluxDB API client libraries
The curl or influx commands shown above are just two examples how to interact with the InfluxDB API. Numerous InfluxDB API client libraries are provided by the open source community.
InfluxDB from Python
Install InfluxDB-Python:
pip3 install influxdb
Example Python3 code:
#!/usr/bin/env python3

import influxdb

client = influxdb.InfluxDBClient(
    host='influxdb.phys.ethz.ch',
    port=443,
    username='<user>',
    password='<pw>',
    database='<db>',
    ssl=True,
    verify_ssl=True
)

json_body = [
    {
        "measurement": "cpu_load_short",
        "tags": {
            "host": "server01",
            "lab": "hpt-h-5"
        },
        "time": "2019-10-02T10:00:00Z",
        "fields": {
            "value": 0.64
        }
    }
]

client.write_points(json_body)
result = client.query('select value from cpu_load_short;')
print("Result: {0}".format(result))
Downsampling and retention
Storage space and other resources are limited. Sometimes it may be necessary to reduce data, which reduces disk space for historic data and speeds up queries when selecting over large time ranges. While we do not have fixed limits, we monitor resource usage and would like to keep the service stable and ensure resources are fairly shared among groups.
To downsample and/or letting old data expire, use Retention Policies (RP) and Continuous Queries (CQ).
Here we will show an example how to add automatic downsampling and retention to our cpu example from above. Lets assume we send a measurement of the cpu usage every second (1 second resolution) and we now would like to automatically downsample to 2 separate retention policies with 1 minute (kept for 1 year) and 10 minute resolution (kept for 10 years). We want to keep the 1 second resolution for 3 months.
To create 2 RPs (older data than DURATION will be discarded),
please contact us to create them (RP management is limited to server admins):
CREATE RETENTION POLICY "1m" ON "mydb" DURATION 52w REPLICATION 1
CREATE RETENTION POLICY "10m" ON "mydb" DURATION 520w REPLICATION 1
Connect using the influx CLI to the db (mydb):
influx -precision rfc3339 -host influxdb.phys.ethz.ch -port 443 -ssl \
-database mydb -username mydb_rw -password <pw>
Connected to https://influxdb.phys.ethz.ch version 1.8.7
InfluxDB shell version: 1.6.7~rc0
> USE mydb
Using database mydb
Create 2 CQs with automatic downsampling:
CREATE CONTINUOUS QUERY "cq_1m" ON "mydb" BEGIN SELECT mean("value") AS "value" INTO "1m".:MEASUREMENT FROM /.*/ GROUP BY time(1m),* END
CREATE CONTINUOUS QUERY "cq_10m" ON "mydb" BEGIN SELECT mean("value") AS "value" INTO "10m".:MEASUREMENT FROM /.*/ GROUP BY time(10m),* END
In the best case (as in this example) all measurements contain a single field named value.
If not use the following query to show all field keys with data types and adapt queries accordingly:
SHOW FIELD KEYS
If data also contains integers, they can be type casted to float (returns no data if the query attempts to cast an integer or float to a string or boolean):
SELECT mean("value"::float) AS "value" FROM /.*/ GROUP BY time(1m),*
These CQs will now run every time interval specified in the time(interval) function for the time range from now() - interval to now(), and insert the downsampled data into the RPs defined above. Old data will not be automatically downsampled. To do that, we can downsample it manually, example:
SELECT mean("value") AS "value" INTO "1m".:MEASUREMENT FROM /.*/ GROUP BY time(1m),*
SELECT mean("value") AS "value" INTO "10m".:MEASUREMENT FROM /.*/ GROUP BY time(10m),*
See write aggregated results to a measurement if you want to limit the time range, example:
SELECT mean("value") AS "value" INTO "10m".:MEASUREMENT FROM /.*/ WHERE time >= '2022-01-24T13:00:00Z' AND time <= '2022-01-24T14:00:00Z' GROUP BY time(10m),*
Now that our 2 additional retention policies are ready and filled with data,
we can alter the default retention policy (autogen) to discard data older than 3 months.
Please contact us to alter it (RP management is limited to server admins):
ALTER RETENTION POLICY autogen ON mydb DURATION 90d DEFAULT
Service overview
Server metrics
Real-time server metrics of the system hosting both InfluxDB and Grafana services.
Total CPU utilization (all cores)
- 100% here means there is no CPU idle time at all. Also keep an eye on iowait
(-%). If it is constantly high, the disks are the bottleneck and slow the system down.
Memory usage
- Keep an eye on the dimension used, if it maxes out queries may be too heavy and services could be interrupted. You can ignore cached, which is the disk cache that automatically adjusts depending on the available free (unused) memory.