Grafana
See also InfluxDB and join the #grafana:phys.ethz.ch chat room.
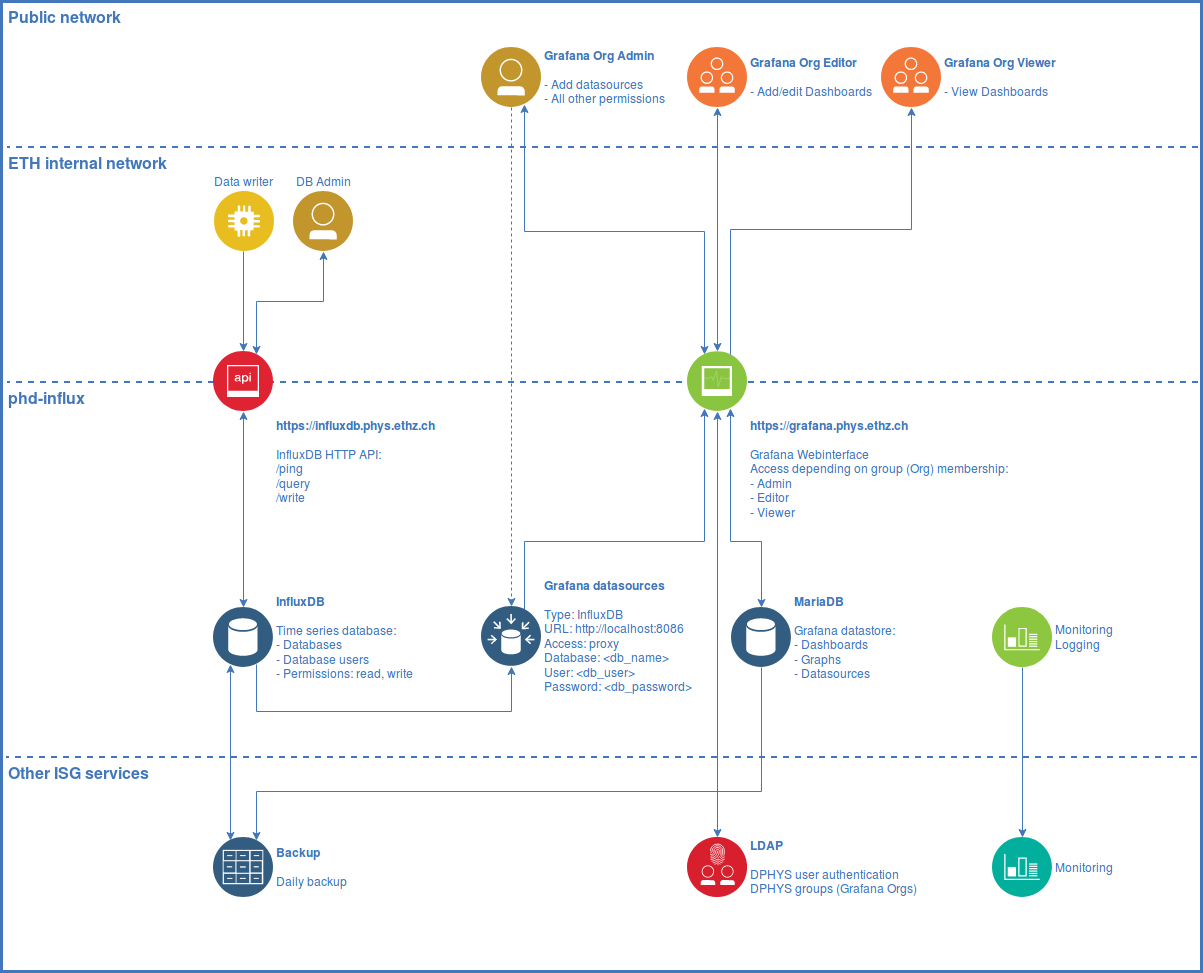
We provide a Grafana service at grafana.phys.ethz.ch using InfluxDB as back-end for time series data. To request a group-site (grafana organization) or access to an existing group, please contact us, providing the desired organization name and ldap group-mappings (see below).
Grafana is an open-source, general purpose dashboard and graph composer, which runs as a web application. It supports graphite, InfluxDB or opentsdb as back-ends.
Organizations
The grafana web-interface is split into organizations, each having its own set of dashboards and datasources. Any datasource (InfluxDB) may be added to any organization as long as the org. admin has the respective username and password for the database, which they can retrieve from the dashboard home/admin/databases.
Organization membership is controlled via LDAP groups. Manual membership administration in Grafana has no effect for D-PHYS users.
Login using your D-PHYS Account. To switch to another organization: Choose your org in the drop-down menu in the top left corner.
LDAP Group mappings
The organization membership is mapped via ldap groups. To view current members of ldap groups, visit our account page. The following grafana org. roles can be assigned to ldap groups, which will be assigned to all members of the group as soon as they log in at the grafana web interface:
Admin: Allowed to add datasources, has all permissionsEditor: Allowed to add/edit dashboardsViewer: Allowed to view dashboards
All users are members of the org. dphys with role Viewer by default, which is automatically selected on the first login.
Usually we create a grafana<yourorg>admin (Admin) group that is managed by some member of your group
and assign the Editor permission to all members of your usual LDAP group.
Add datasource (InfluxDB)
As org. admin you are able to add InfluxDB datasources for your organization using the parameters below:
| Field | Value |
|---|---|
| Type | InfluxDB |
| URL | http://localhost:8086 |
| Access | Server (Default) |
| Database | <db_name> |
| User | <db_user> |
| Password | <db_password> |
To request a new database see InfluxDB.
It is also possible to connect to any other datasource (incl. such from other servers or software).
Currently: any http(s), influxdb, prometheus, opentsdb, graphite, mariadb, postgresql, mssql.
Please contact us in case you need anything else.
Using InfluxDB in Grafana
To get started using InfluxDB in Grafana refer to the official documentation.
How to share or present dashboards
To share dashboards without the need for authentication using a D-PHYS Account, for example to present it on a kiosk-style monitor, you can create a snapshot.
A snapshot allows to export an interactive (but static) dashboard via a link publicly. It can be accessed without authentication by anyone who has the link. See documentation for more information.
If you have the dashboard open, click on the share symbol left of the
save button, then select snapshot and Local Snapshot button. This
will create a link that you can share.
You can review/delete the snapshots at /dashboard/snapshots
or on the left side via Dashboards > Snapshots. The same can be done with single panels.
Sending alerts to Matrix
| Key Terms | Description |
|---|---|
| Alert rule | Define the conditions that trigger an alert |
| Alert instance | Specific occurrence of an alert |
| Contact point | Destination where alert notifications are sent |
| Notification policy | Determine how alerts are routed to contact points |
1. Set up alert rule
Provide the following settings:
- Select data source
- Define condition for firing
- Evaluation Behavior
- Select Grafana folder
- Evaluation Group
- Pending Period
2. Set up contact point
Follow the instructions to use the Webhook API with the Grafana webhook integration: see Grafana webhook notification.
| Field | Setting |
|---|---|
| Integration | Webhook |
| URL | URL to the webhook API |
- You can send a test message to verify that everything works
- Optional: add
?template=<template>to specify how notifications get displayed. See docs.
3. Define notification policy
A notification policy connects alert rules to contact point
| Field | Settings |
|---|---|
| Matching labels | Labels that uniquely identify your alert rule |
| Contact point | Select your contact point |
Grafana Alerting docs
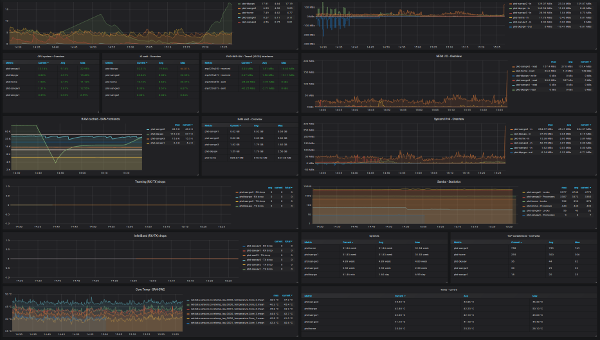
Service overview
Server metrics
Real-time server metrics of the system hosting both InfluxDB and Grafana services.
Total CPU utilization (all cores)
- 100% here means there is no CPU idle time at all. Also keep an eye on iowait
(-%). If it is constantly high, the disks are the bottleneck and slow the system down.
Memory usage
- Keep an eye on the dimension used, if it maxes out queries may be too heavy and services could be interrupted. You can ignore cached, which is the disk cache that automatically adjusts depending on the available free (unused) memory.