VMchart
Update IV: multi-threaded server queries speed things up even more
Update III: BTRFS support and navigation menu
Update II: show back-end history to detect failing LUNs
Update: now displays back-end information tooltips in SAN setups! (see below for screenshot)
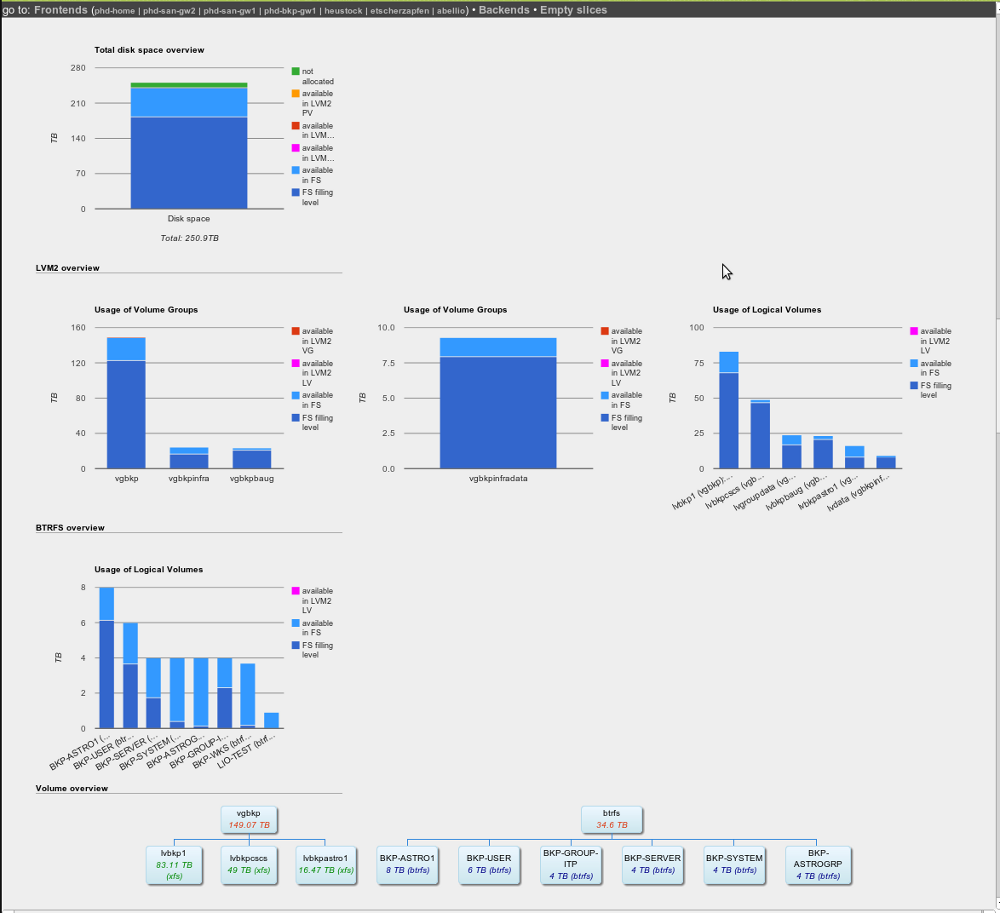
We manage quite a number of file servers and while volume management is a wonderful technology offering a lot of flexibility, its many layers (PV, VG, LV, file system..) sometimes make you wonder where all those terabytes went. We were looking for a quick and direct way to visualize the available file space. Since we couldn't find one, we wrote our own: VMchart. It generates a nice website with lots of graphs using Google Chart Tools.
It consists of two parts: the CGI script runs on a web server and queries the file servers via ssh. Those file servers hold the client script that send the LVM2 and BTRFS data in JSON format. The client script reads a config file lvm2.conf that looks like this:
UNIT
REGEXP (optional)
VG1
VG2
..
VGn
where UNIT is either t or g for terabytes or gigabytes and VGx specify volume groups that will be skipped (usually the system VG). REGEXP is meant for SAN front-end servers that use a lot of remote LUNs, e.g. via iSCSI. In our case it looks like this: /dev/iscsi/\d?([\d\w]+)-(.+) in order to match LUNs like /dev/iscsi/1bkp12-2T-j1 for host name (bkp12) and LUN (2T-j1). If you omit this line, no back-end information will be gathered.
All files for the project can be found on GitHub.
The CGI reads a file hostlist containing lines like
host1 - Host1 description
host2 - Host2 description
Things should be pretty self-explanatory, so please let us know if you encounter problems.
As usual, IE is not working properly unless you disable some compatibility mode in IE9. Forget about earlier versions.